Today’s digital world is flooded daily with a mass of data and facts. Visualisation of data, so called infographics, can be a great tool to handle the large amounts of information one is confronted with in everyday life. Infographics help to make complex topics easier to understand. In today’s world we all have apps for everything and can access a lot of information with one single swipe. Textual journalism as it is known from newspapers is slowly reaching its limits. This journalism is necessary, but journalism also needs to communicate in other ways.
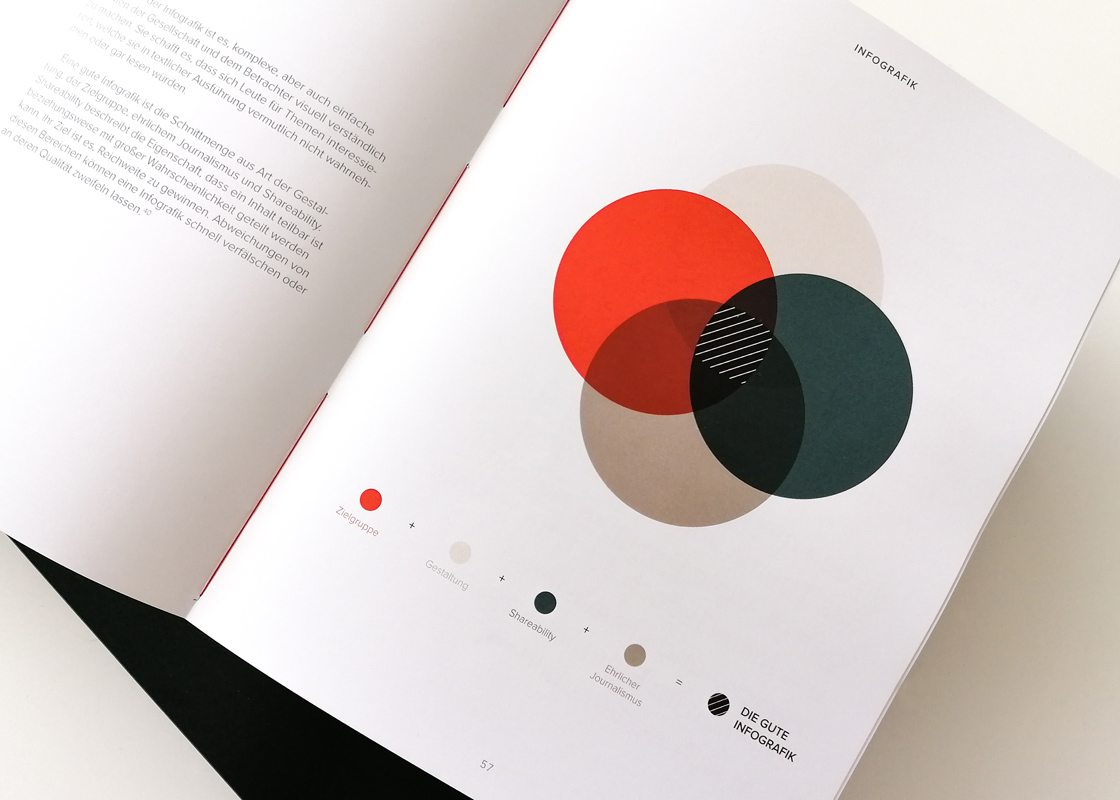
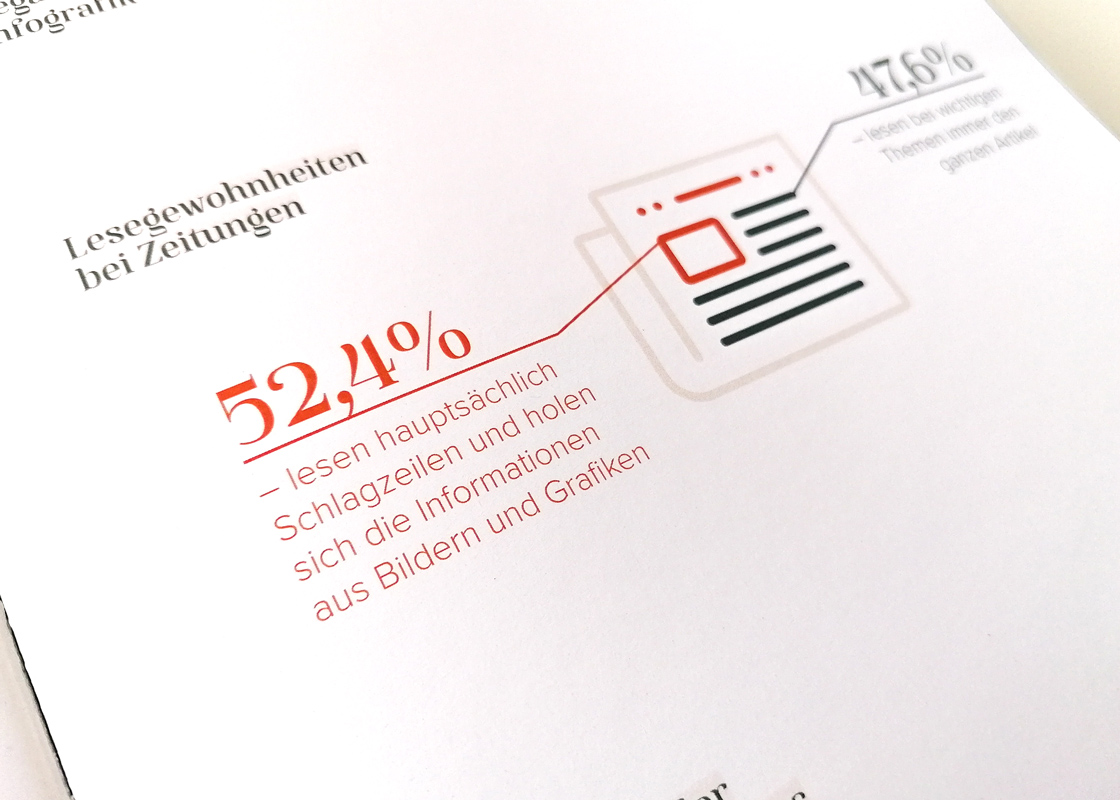
Visual journalism is utilised and is, in connection with infographics, an essential component in transmitting information because information captured by the eyes is better ingrained in the memory. This master’s thesis analyses surveys and statistics with respect to the perception of images and text and visualises their statements with infographics. The goal is to show future designers the necessity of visual journalism and to illustrate the conscious and responsible use of infographics.
